• Brazil - Financial Crisis

    Double Bubble

    This post is called the Double Bubble, because it is clear that there have been two very significant bubbles to ripple through the world in the last 15 years. Just looking at the Dow Jones Industrial average, there is a bubble which begins circa 1995 and bottoms out circa 2003. Immediately after the tech bubble bottoms, a new bubble begins to form, which is the crisis we face today. As has already been discussed in previous blogs, Greenspan intentionally created a second bubble by lowering interest rates after the Tech Bubble popped.

    This blog will analyze whether other countries are suffering through the Double Bubble impact, and hence the same dire outlook as the United States. The key observation is that these country’s monetary policies must be acting in concert with the American policy. Just because Greenspan lowers interest rates (eg. expanding money supply) in the US should not create a bubble in the German stock market. They all must act in unison.

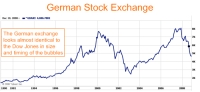
    As shown in the German chart below, that is exactly what has happened. It is almsot a mirror of the American stock market. The bubble begins in circa 1995, ends in 2003, and immediately a new bubble begins and pops in 2008. I have analyzed all of the stock markets based on the Euro, and all of them have the same Double Bubble. This is of no surprise since money supply and interest rates for the Euro are controlled through the EU Central Bank. Furthermore, EU interest rates are among the lowest in the world.

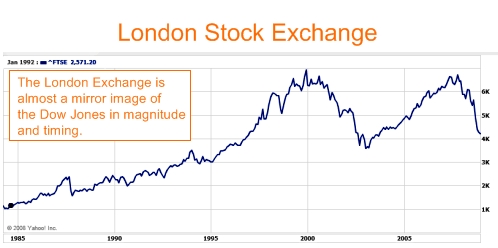
    Due to space considerations, I will only include the UK stock chart to show that indeed our friends on the other side of the pond have the Double Bubble as well. Suffice it to say, that virtually every Western European nation, in or out of the EU, have the Double Bubble. The list includes France, Germany, Sweden, Norway, Switzerland, UK and many more.
    However, if we look beyond the United States and Western Europe, the signs of the Double Bubble begin to weaken. Yes, there are signs of a bubble but the dynamics are very different. Below find the Indian Stock Market. Unlike the American Double Bubble, there is one single bubble which begins in 2003 and ends in 2008. The magnitude of the bubble is a LOT larger than the Double Bubble. From the period from 2003-2008, the Double Bubble increased various stock markets between 2-3X. The Indian single bubble boosts the stock market a whopping 5X in the space of 5 years.
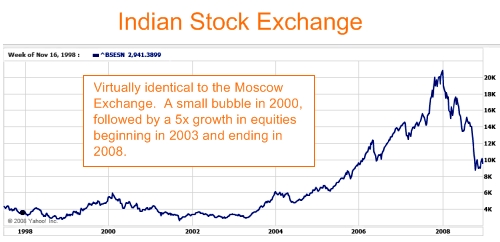
    I am only including the Russian stock market on the chart below. The Russian stock market almost looks identical to the Indian. It begin circa 2003, and drives up the market 5X. I also analyzed the Brazilian and Chinese markets in earlier posts, and these four markets all have the single bubble dynamics. (Begins in 2003, a 5X increase in stock markets, and pops in 2008).
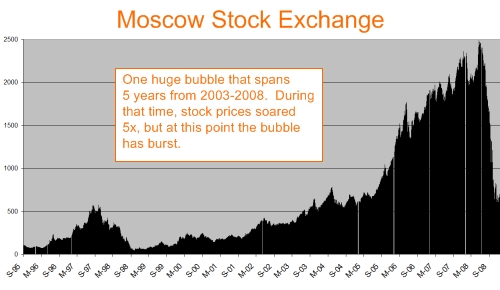
    Based on all of this analysis, I came to the conclusion that the least impacted countries are Brazil, Russia, India and China. I began investigating trading in those currencies. I found several on line sites such as forex.com, but none of these sites trade in these currencies. In fact, the most common currencies are the currencies of the Double Bubble!

    Now the picture is coming together. In today’s world, it is difficult to trade in currencies that have high interest rates. Note: I said difficult, it is not impossible but there are more barriers to the free movement of money to high interest rate countries. OTOH, it is simple for the low interest countries. I believe these countries almost have an accord or a pact in today’s world where their central banks act as one and their currencies are freely traded.

    The conclusions are still the same. The key to bubble avoidance is high interest rates. High interest rates minimize the flow of money into the stock markets creating an artificial wealth euphoria. This analysis further strengthens the notion that the Double Bubble is not global in nature and the primary winners will be the high growth, high interest quartet of Brazil, Russia, India, and China.
    Leave a Reply


  • Brazil - Financial Crisis

    How Global is the Bubble?

    We keep on hearing that the current economic crisis is global in nature. That is to say, that each and every country in the world will suffer along with the United States. To be honest, this entire premise seems false to me. Surely there would be winners and losers as this economic crisis unfolds. Plus on top of this, the US is the largest debtor nation in the world. Surely the lenders will survive the crisis better than the debtors.
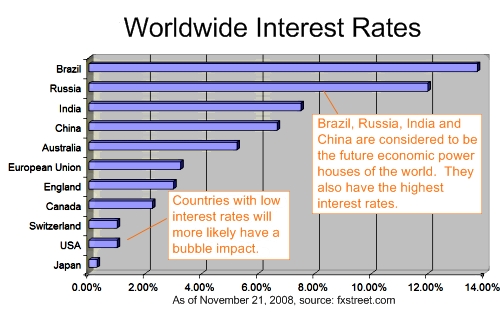
    The chart below takes a peek at the interest rates around the world. The first thing that I notice is that there is a huge spread in interest rates from various countries. Their appears to be high interest rates in countries that are expanding such as China, Russia, India and Brazil. And then the balance of the countries have extremely low interest rates such as Japan, US, Europe and Great Britain. This chart is critical for understanding the economic crisis since artificially low interest rates are the root cause of the bubbles.

    First, I took a look at the French stock market. The reason was to do a sanity check on the relationship between the dollar/euro, and the Dow Jones and the French stock market. As almost any investor knows, when interest rates go down, the stock market accelerates. The reasons are quite simple. Investors are constantly looking for higher returns, and as interest rates drop, the stock market spikes. This simple fact is one of the key underlying dynamics of the US financial crisis. The chart below shows clearly that the French market has experienced two bubbles and the timings are eerily similar to the Dow Jones bubble in the United States. Looks like at least to some degree that the Euro’s monetary policy was tied to US financial policy.

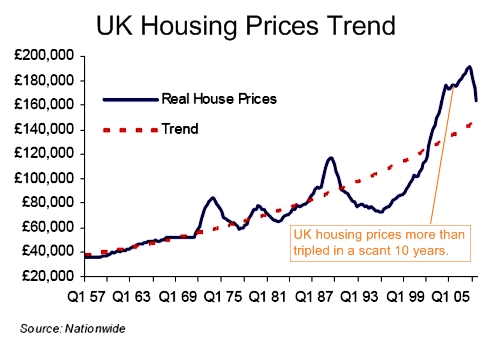
    Next, let’s look at housing prices in Great Britain. Holy crap! In just 10 years, British housing prices have more than tripled from a low of £60,000 to a high of close to £200,000. Yes, the US had a housing bubble but in the same period of time, US prices did not even double. In this regard, the bubble is much more severe in Great Britain than the United States.

    Looks like Europe may well be going down the tubes with the Americans. I was chatting with a friend in Europe last week, and he remarked that a European economist was worried that the entire Euro system might collapse in the next two years. Yikes.

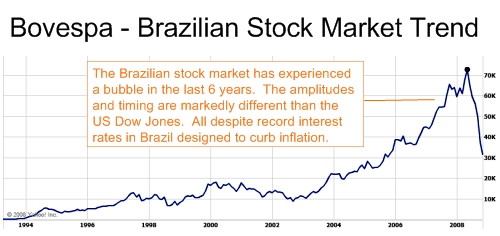
    Below, you can find the performance of the Brazilian stock market, known as the Bovespa. To be honest, I was not expecting to see a bubble on this chart because Brazilian interest rates are the highest in the free world. With such high interest rates, why invest in the stock market if you can make 13% risk free? But lo and behold, there is a bubble! It does not have two peaks like the French, British and US stock markets, but there is one big pronounced peak. The good news is that it is correcting quickly. Since last 2007, the Bovespa has already lost more than 1/2 of its value. It makes sense to me, with high interest rates, there is less money to drive up prices, and less money to prop them up on the downside.

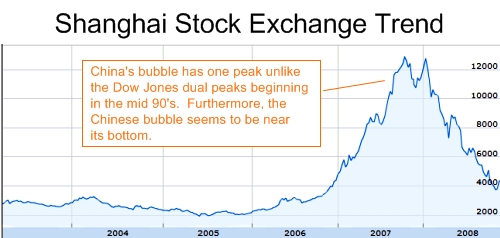
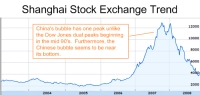
    And last but not least is China. China like Brazil has experienced a bubble, but it seems to be only two years in length and it appears to be almost over. Of all the bubbles that I have analyzed the Chinese bubble looks to be the smallest. Now this is making sense. China has become the world’s bank, lending money to other nation’s at a record pace. Heck, China funded the American war in Iraq. China’s monetary policy has been almost perfect. China’s problem was exactly the opposite of the United States. China has been trying not to grow their economy too fast. Their fear was that if the economy grew too fast, that inflation would grow out of control.

    But here’s the big news. In the last two months, Russia and Brazil have raised interest rates! One more time, they raised interest rates in the last two months. This at the time when America, Europe and Japan are lowering them to zero as fast as possible. I believe that interest rates are the key to monetary policy. When trying to correct a bubble, there is only one solution – raise interest rates. Raising interest rates contracts the money supply, and money moves out of higher risk ventures such as the stock market and mortgages.

    Living down here in Brazil, I can tell you that the interest rates are real. I go to my bank once a month to check, and I am realizing well over 1% interest rate a month risk free. As the Brazilian stock market has fallen off a cliff, I just sit back and collect my interest. It is awesome, and it is truly the nest egg that I have always wanted to build.

    I am going to be moving more money down to Brazil. The dollar has been rising lately against almost all major currencies, and in my view, this is the perfect time to be selling dollars.

    Leave a Reply


  • Financial Crisis - Politics

    The Bubble Recovery

    One of the greatest travesties to this bubble is the incredible American deficit under the Bush administration. The deficit has ballooned by over $5T in a scant 8 years. We can all agree that this is highly fiscally irresponsible, but the question remains, “Where did all this money go?”
    After all, Bush is a Republican, and the funds certainly were not spent on liberal causes such as welfare and education. Given the record price at the gas pump, the funds were not spent on alternative energies, or more energy efficient cars. In fact, I think that we can look back at the success of the Humvee as a unique product of the Bush administration.

    So show me the MONEY. By all estimates, the war in Iraq has cost $500B, but let’s be generous and assume that all the money has been squandered and there is no economic return on the American economy. Furthermore, let’s round it up to $1T. So there is still $4T unaccounted.

    The chart above explains a large portion of the Bush’s incredible $5T deficit. One of the first things Bush did as president was honoring his campaign promise to give huge tax cuts to the wealthy. This was signed into law in June 2001.

    The impact was swift. Government tax revenues essentially fell off a cliff during Bush’s first term. Bush’s rationale was that the tax cuts would trickle down to the rest of the economy and create jobs. This chart suggests the opposite. If jobs had been created, then revenues would not have fallen. In fact, they should have gone up. Bush’s tax cuts to the wealthy did not create jobs. In fact, these tax cuts have substantially increased the deficit and perhaps was one of the underlying contributors to the bubble.

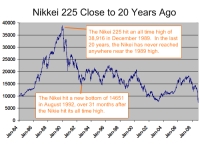
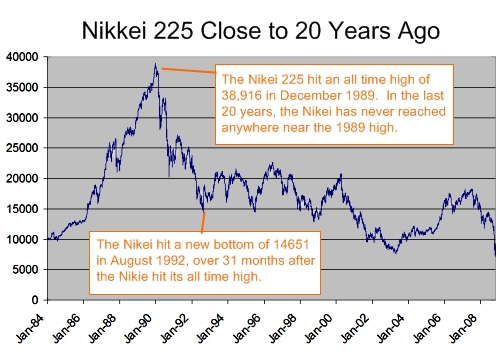
    The Nikkei 225 is the Japanese version of the Dow Jones 500. This chart chronicles what is commonly referred to as the Japanese Asset Price Bubble. In addition to the run up in stocks, it was accompanied by a tremendous run up in real estate prices. Some places in Tokyo were being sold at over $100,000 a square foot. A square foot is the size of one floor tile, and it was selling for the price of an entire house. Sound familiar?

    Once the bubble popped in 1989, the Japanese Federal Reserve continued to spur the economy by lowering interest rates and printing more money. These actions were ineffectual, and interest rates hit zero. Can you believe it? They were essentially giving away money and there were no takers. The credit crisis would not abate.

    The last straw was when the government began to buy out failing banks and businesses creating what became known as zombie businesses. This era in Japanese history is known as the lost decade. Historians blame primarily the Japanese Feds insistence in lowering interest rates and bailing out failed institutions.

    If you have not already figured out where this is going. We are repeating each and every mistake that happened in Japan beginning in the mid 80’s. We made the exact same mistakes as the Japanese that caused a stock and housing bubble. And now we are replicating their errors in resolving the problems. The end result for Japan was the lost decade, and perhaps the US is in store for a similar fate.

    Leave a Reply


  • Financial Crisis - Politics

    Measuring the Bubble (Depression Deja Vu)

    The media is calling this bubble the worst since the Great Depression. That sure sounds scary, but where are the facts? What makes them believe this bubble is so severe relative to other bubbles? Are there any facts to feed the panic or just pure fear?
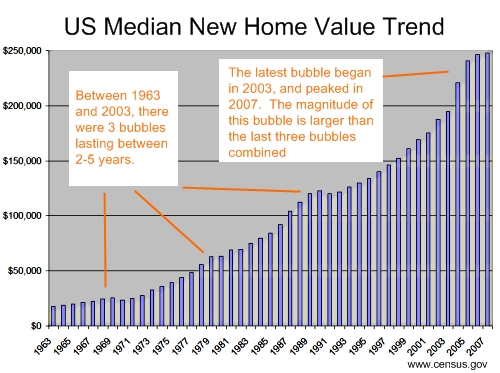
    I decided to take a look at some of the facts to measure the bubble and finally set some expectations about the size of the bubble. First I looked at the average housing pricing for the last 45 years. I pulled all of the information from www.census.gov which is a terrific place to gather macro economic information.

    Just quick look at the chart, and it is easy to see where the bubbles have occurred. There were indeed housing bubbles in 1969, 1980, and a slightly larger bubble in 1989. Once each bubble hit, the decline in housing prices never lasted more than one year. Until now.

    It is clear from the data, that there was a tremendous spike in housing prices in 2005. Unbelievable as it might sound, housing prices jumped over 13% in one year! This was followed by a 9% jump in prices in 2006. Somebody was asleep at the wheel in the Federal Reserve. Warning bells were going off all around them, and they did nothing.

    Perhaps the scariest part of the bubble is its sheer size. Not only are the spikes larger than any other historical precedent, the bubble has persisted longer than anything in the last 45 years.

    The only good news on this chart is that median home prices appear to have peaked in 2007, and although the data is not yet in, it is a good bet that 2008 will be less than 2007. So it is clear that we are beginning the downswing, the only question is how long will it last. And how severe will it be?

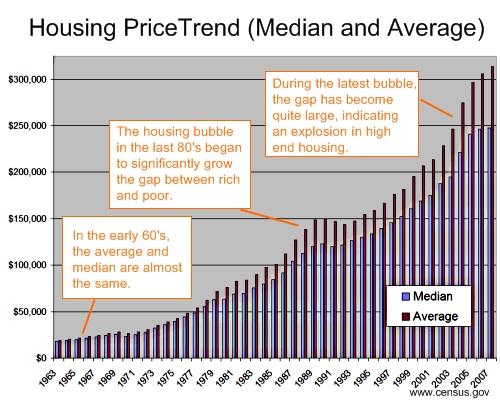
    Next let’s take a look at the same chart but including the average house price along side the median. There is some speculation that the root of the housing bubble is related to laws encouraging mortgages to minorities. This chart rebukes that theory.

    There can only be one reason why the average is growing faster than the median. HIGH END HOUSING. Eyeballing the numbers, I would bet heavily that million dollar homes are driving the bubble, not $100K homes to minorities.

    But wait, there is one more piece of bad news. The average house price was still growing rapidly in 2007. Note: that the median had hit a plateau. In fact, looking at previous bubbles, this is the first time that the average behaved differently than the median.

    I worry about the underlying dynamics of our economy if the average is so much larger than the median. It suggest that the gap between rich and poor is growing. Living down here in Brazil, I believe that one of America’s strengths in the 60’s and 70’s was an extremely strong middle class.

    But I don’t want to get off track. So the housing data looks bad. Of course, this was entirely preventable, but there is indeed some empirical evidence that this bubble could be equal to that of the Great Depresssion.

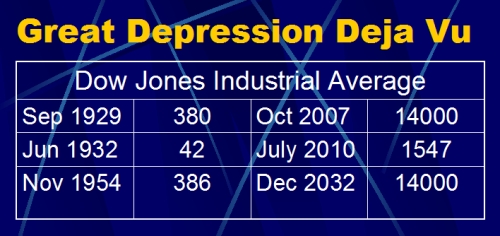
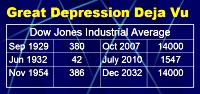
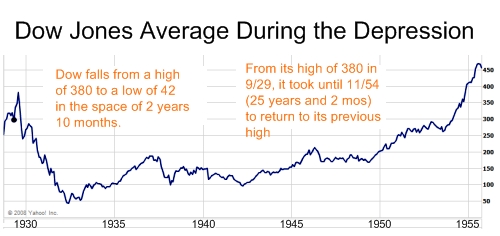
    Lastly, let’s take a look at the Great Depression courtesy of Yahoo Finance. The Great Depression began in September 1929, when the Dow hit a peak of 380. The Dow did not hit bottom until close to three years later. Worse yet, it took over 25 years or a quarter of a century for the Dow to reach its pre-depression levels. Ouch! 25 years is a long time just to get back to break even on your stock portfolio.

    Although there are some indications that this financial crisis could equal the Great Depression. I personally believe that we can do much better. But for the pessimists in the group (and the media as well), here is a simple forecast using the Great Depression as a guide line. Once we see these numbers, it is easy to see why some people decided to keep their money in a mattress. Much safer.

    One comment on “Measuring the Bubble (Depression Deja Vu)

    Leave a Reply


  • Financial Crisis - Politics

    Why the Bailout Will Fail

    Yesterday, the House of Representatives approved the $700B bailout plan, and President Bush quickly signed it into law. Sigh! What I dislike most about this bill was that everyone including the President was acting in a panic. No one was calmly analyzing the underlying magnitude of the credit crisis, and the fundamentals that would drive our great country so close to the edge of a cliff. I’ll try to do that here.
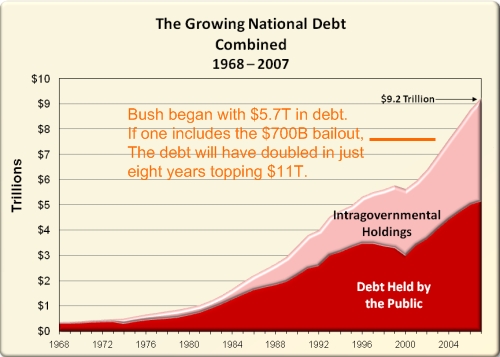
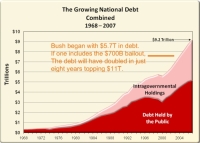
    The first chart is a simple graph of the trend of our national debt. Bush inherited a $5.7T debt, and by the end of his presidency, it will most likely exceed $11T. In a short eight years, Bush and the Republicans have doubled the size of the deficit. Let’s put this another way. Bush created a deficit in eiqht years equal to all 42 presidents before him COMBINED. There are only two ways to create a disaster of this magnitude.

    Create massive tax breaks. Not only must the tax breaks be massive, but they must provide little or no economic impact to the economy. This is no easy task, since normally tax breaks inherently give the economy a bump. Bush has proven with surgical accuracy that if you target the nation’s wealthiest citizens, as well as the wealthiest corporations such as Wall Street, oil companies, and pharmaceutical, it can be achieved. The key to Bush’s tax plans is to place as much money in as few hands as possible. Frankly, I would not have predicted it, but it appears to have worked like a charm.

    Spend like there is no tomorrow. Once the Republicans took hold of both houses and the executive branch, it must have been like Dad giving the kids the keys to the summer home. LET’S PARTY! And party they did. There was no bill too expensive, and no earmark too small. Basically, there was no budget whatsoever. Of course, this bottomless-money-pit mentality also explains our stubbornness in exiting Iraq. In retrospect, it is amazing that the original budget for the war was $50B.

    Look at the slope of the line during the last 7 years. We are in debt like we have never been in debt. America needs money and FAST!

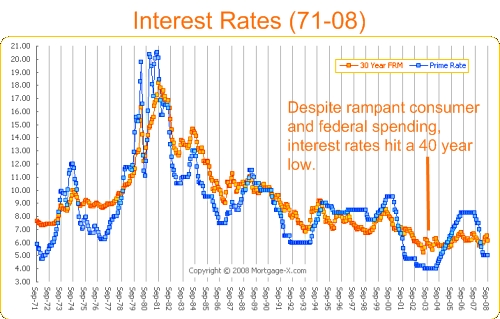
    Which brings me to the next graph. If we are plowing through money, and we have made a conscious effort to reduce revenue (through tax decreases), one would think that America would have high interest rates in an effort to attract capital. This is where things start falling apart. The exact opposite is true. While our need for other people’s money was reaching addictive levels, our price for that money (interest rates), was abnormally low.

    It makes no sense. Think of a guy with a serious gambling problem. Let’s call him Uncle Sam and he is on a bad run of luck. Sam normally gets his cash from Louie the Shark, but Louie is getting nervous because each time Sam needs more and more money. So this time, Louie says No to Sam. So Sam has no choice but to request a loan from Bobby Ballbreaker. Do you think that Bobby is going to give Sam a better deal than Louie? Of course not.

    Then why are our interest rates so low? Today’s interest rates are lower than the Clinton era and the Reagan era. Who benefits? When interest rates are low, perhaps the first to profit is Wall Street. Low interest rates drives money into the stock market where people can get a higher return. This is a normal market dynamic unless the interest rates are artificially low.

    I had a good friend remark close to two year ago. America is awash in cash trying to find a home. I have received hundreds of calls from companies trying to refinance my home. Note: I don’t have a mortgage on either of my residences. On top of this, during the Bush era, my mailbox was stuffed with preapproved credit cards. We should have seen it as a sign of things to come, but there was way too much money trying to find a home.

    It is clear that this excess liquidity found its way into the mortgage market. With interest rates so low, any nut job could get a mortgage. Basically, if you have a pulse and a social security number, here’s a brand new home. Using the bubble mentality, it really doesn’t matter if the owner defaults if the value of the house is worth more. Of course, the wheels fall off the bus, when housing prices decline.

    Please note: Unlike the presidential candidates, I do not believe this is a function of greed on Wall Street. It is a function of an interest rate that is lower than the underlying economics of the economy.

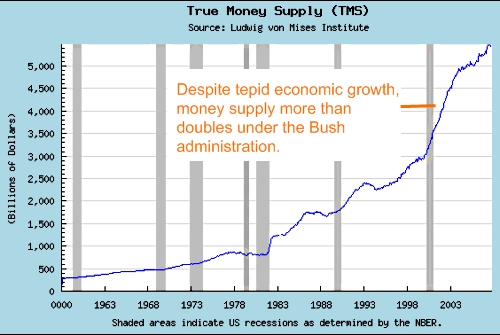
    The last slide completes the picture. Who is the culprit? The Fed. There is only one way to pull off this economic illusion. As I discussed in Bubble Economics, the first thing is to greatly devalue the dollar. This ensures that America is an attractive place for foreign capital. Then the second piece is to expand the money supply to accommodate the influx of capital. Let’s make this clear. This was a conscious decision to expand the money supply to keep interest rates artificially low. As is painfully evident today, it created economic growth driven by the housing sector, but it was wholly unsustainable. There was only one outcome and it is the one that we are experiencing today.

    Which brings us to the bailout. This bail out will fail for one reason alone. The US government is fighting the market. The underlying issue is that American interest rates are too damn LOW. The credit markets are frozen because they see an adjustment on the horizon. If we just let interest rates float as market dictates, credit would free up immediately, albeit at higher interest rates. This is the flaw. $700B can keep us at an artificially low interest rate for a period of time, but we cannot fight the market forever. Ultimately, interest rates must rise, and it will have a negative impact on the American economy, stock prices, and housing prices. $700B can delay the inevitable, but it cannot stop it from happening. For me, I would rather see it happen sooner rather than later so we can get on with our lives. Oh and we would also save $700B of taxpayer money. It is truly stunning that we think we can throw money at the problem, when the root issue is our free wheeling government.

    One comment on “Why the Bailout Will Fail

    1. Two reasons the bailout will fail.

      1. The amount is to small and the allocation is corrupt.

      2. The CDS (Swaps) is est. to be 50 to 75 trillion depending on who you talk to and they don’t know for sure.

      No one knows how deep the cancer is not only in the U.S. but through out the world.

    Leave a Reply