 This post is called the Double Bubble, because it is clear that there have been two very significant bubbles to ripple through the world in the last 15 years. Just looking at the Dow Jones Industrial average, there is a bubble which begins circa 1995 and bottoms out circa 2003. Immediately after the tech bubble bottoms, a new bubble begins to form, which is the crisis we face today. As has already been discussed in previous blogs, Greenspan intentionally created a second bubble by lowering interest rates after the Tech Bubble popped.
This blog will analyze whether other countries are suffering through the Double Bubble impact, and hence the same dire outlook as the United States. The key observation is that these country’s monetary policies must be acting in concert with the American policy. Just because Greenspan lowers interest rates (eg. expanding money supply) in the US should not create a bubble in the German stock market. They all must act in unison.
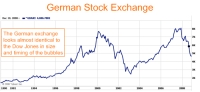
As shown in the German chart below, that is exactly what has happened. It is almsot a mirror of the American stock market. The bubble begins in circa 1995, ends in 2003, and immediately a new bubble begins and pops in 2008. I have analyzed all of the stock markets based on the Euro, and all of them have the same Double Bubble. This is of no surprise since money supply and interest rates for the Euro are controlled through the EU Central Bank. Furthermore, EU interest rates are among the lowest in the world.

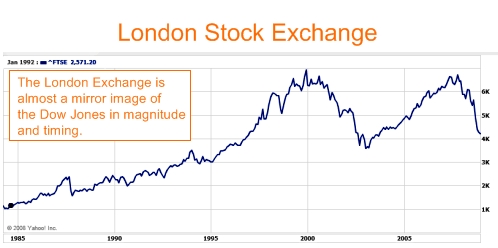
Due to space considerations, I will only include the UK stock chart to show that indeed our friends on the other side of the pond have the Double Bubble as well. Suffice it to say, that virtually every Western European nation, in or out of the EU, have the Double Bubble. The list includes France, Germany, Sweden, Norway, Switzerland, UK and many more.
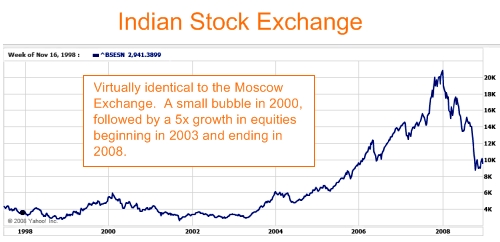
However, if we look beyond the United States and Western Europe, the signs of the Double Bubble begin to weaken. Yes, there are signs of a bubble but the dynamics are very different. Below find the Indian Stock Market. Unlike the American Double Bubble, there is one single bubble which begins in 2003 and ends in 2008. The magnitude of the bubble is a LOT larger than the Double Bubble. From the period from 2003-2008, the Double Bubble increased various stock markets between 2-3X. The Indian single bubble boosts the stock market a whopping 5X in the space of 5 years.
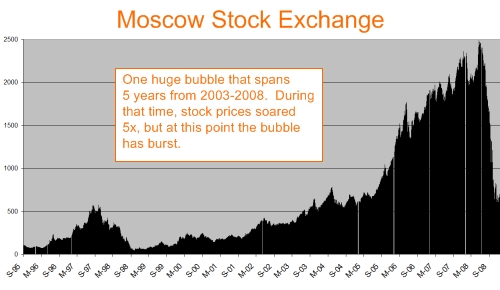
I am only including the Russian stock market on the chart below. The Russian stock market almost looks identical to the Indian. It begin circa 2003, and drives up the market 5X. I also analyzed the Brazilian and Chinese markets in earlier posts, and these four markets all have the single bubble dynamics. (Begins in 2003, a 5X increase in stock markets, and pops in 2008).
Based on all of this analysis, I came to the conclusion that the least impacted countries are Brazil, Russia, India and China. I began investigating trading in those currencies. I found several on line sites such as forex.com, but none of these sites trade in these currencies. In fact, the most common currencies are the currencies of the Double Bubble!
Now the picture is coming together. In today’s world, it is difficult to trade in currencies that have high interest rates. Note: I said difficult, it is not impossible but there are more barriers to the free movement of money to high interest rate countries. OTOH, it is simple for the low interest countries. I believe these countries almost have an accord or a pact in today’s world where their central banks act as one and their currencies are freely traded.
The conclusions are still the same. The key to bubble avoidance is high interest rates. High interest rates minimize the flow of money into the stock markets creating an artificial wealth euphoria. This analysis further strengthens the notion that the Double Bubble is not global in nature and the primary winners will be the high growth, high interest quartet of Brazil, Russia, India, and China.